

Prepared Exclusively for The Albert Family Trust
The Albert Family Trust · June 2026

Since 2013, the LAAA Team has closed 460+ multifamily transactions totaling $1.47B+ in volume across Los Angeles, Ventura, and Santa Barbara counties, with particular depth across the San Fernando Valley — from Sherman Oaks, Studio City, and North Hollywood to the West Valley submarkets of Northridge, Reseda, Canoga Park, and Chatsworth.
Our practice is built on disciplined underwriting, the deepest comparable-sales dataset in the submarket, and a marketing engine that reaches every active multifamily buyer in Los Angeles. We advise owners on when and how to sell — not just whether — and we price to clear, not to languish.
For 21727 Lassen St, that means an evidence-based opinion of value anchored in recent Chatsworth, Northridge, and West Valley apartment sales, presented with the same rigor we would bring to defending the price against a buyer's due-diligence challenge.


• Chairman's Club - Marcus & Millichap's top-tier annual honor
• National Achievement Award - multiple years, both partners
• #1 Most Active Multifamily Team in LA County - CoStar 2019-2021
• Sales Recognition Award - every year since 2016
• 40+ transactions per year - one of SoCal's most active groups
21727 Lassen St is a 7-unit, two-story townhouse-style apartment building in the heart of Chatsworth in the West San Fernando Valley. Built in 1976 and held for decades by the same family ownership, the property comprises five 1BR/1BA townhouse units, one 2BR/1BA townhouse unit, and one 2BR/2BA unit on the second story, set on an 8,051 SF LAR3 lot with a pitched roof, on-site laundry, and rear parking.
The asset is offered with substantial embedded upside: in-place rents average roughly 33% below today's Chatsworth market, the product of long-tenured residents (two in place since 1991 and one since 1994). Current scheduled rent of $136,859 compares to an estimated $182,700 at market — a path to mark-to-market that a buyer captures through natural turnover.
For a yield-and-growth buyer, 21727 Lassen offers a stabilized in-place cap of approximately 5.5% that grows toward 8% at market, in a supply-constrained West Valley submarket with strong renter demand. Unusually for an older asset, the current assessed tax basis already sits near the offering price, so reassessment at close is roughly tax-neutral.

Click any image to enlarge. Interior images depict a representative renovated unit and illustrate the post-turn condition achievable as units roll to market. Source: listing media.
Chatsworth anchors the northwest corner of the San Fernando Valley, an established residential community known for single-family character, mountain backdrops, and a deep base of long-term renters. Housing stock is dominated by owner-occupied homes, making well-located older apartment buildings like 21727 Lassen a scarce and durable rental product.
The location offers strong employment access: California State University Northridge (CSUN), Northridge Hospital Medical Center, the Warner Center / Canoga Park office and retail corridor, and Chatsworth's long-standing aerospace and light-industrial employers are all within a short drive. The Chatsworth Transportation Center provides Metrolink and Amtrak service plus the western terminus of the Metro G (Orange) Line, with quick connections to the 118, 101, and 27 (Topanga Canyon) corridors.
The subject sits on Lassen Street, a primary east-west arterial, placing tenants minutes from The Vineyards at Porter Ranch, Northridge Fashion Center, and the Westfield Topanga / Village retail district. The renter base skews toward working families and university-adjacent households who value space, parking, and value relative to the rents commanded in newer product to the south and east.
| Location Details | |
|---|---|
| Submarket | Chatsworth / West Valley |
| ZIP | 91311 |
| Median HH Income | ~$96,000 (area) |
| Median 1BR Rent | ~$2,386/mo |
| Major Employers | CSUN, Northridge Hospital, Warner Center |
| Transit | Metrolink + Metro G Line (Chatsworth) |
| Freeway Access | 118 / 101 / 27 |
| Zoning | LAR3 |
| Property Overview | |
|---|---|
| Units | 7 |
| Year Built | 1976 |
| Building SF | 6,238 |
| Unit Mix | 5x 1BR/1BA, 1x 2BR/1BA, 1x 2BR/2BA |
| Stories | 2 (townhouse-style) |
| Parking | On-site, rear of building |
| Site & Zoning | |
|---|---|
| APN | 2747-021-024 |
| Lot Size | 8,051 SF (0.18 ac) |
| Zoning | LAR3 |
| Construction | Wood frame / stucco |
| Roof | Pitched, composition |
| Building Systems & Capital | |
|---|---|
| HVAC | A/C replaced 2019 (all 7 units) |
| Water Heating | 2 tankless (2022) + 100-gal (2019) |
| Seismic | Soft-story retrofit complete (2021) |
| Laundry | On-site common (income) |
| ADU | Carport-to-ADU plans in progress (2024) |
| Regulatory & Utilities | |
|---|---|
| Rent Control (RSO) | Subject (1976 build, pre-Oct 1978) |
| AB1482 | Applies (RSO is controlling) |
| Owner Pays | Water, sewer, trash, common-area |
| Tenant Pays | In-unit gas & electric |
| Registration | LAHD / SCEP (LA City RSO) |
Current ownership has reinvested in the building's structure and systems over the past several years, materially de-risking the asset for an incoming buyer — most notably completing the mandatory soft-story seismic retrofit. On top of the ~33% rental upside, ownership has also advanced plans to convert the existing carport into a new Accessory Dwelling Unit, creating a path to an income-producing eighth unit.
Source: City of Los Angeles LADBS permit records. Buyer to verify permit status and final sign-offs in due diligence.
A 2024 building permit application is underway to convert the existing 18' × 25'-7" carport into a new Accessory Dwelling Unit per LAMC 12.22-A.33, with plan-check information complete as of 7/25/2024.
A completed ADU would add a potential eighth income stream — and because newly constructed ADUs are exempt from RSO, it can be leased at full market rent, layering incremental yield on top of the building's existing mark-to-market upside.
1031 Exchange Buyers
Investors trading into stable West Valley cash flow with a clear mark-to-market growth path, a durable 1BR-heavy unit mix, and a near-neutral tax reassessment at close.
Private Local Investors
West Valley owner-operators who can capture the rent gap through natural turnover, utility cost recovery, and hands-on management of a 7-unit asset.
Value-Add Multifamily Buyers
Buyers seeking below-market RSO rents (~33% under market) with a measurable path from a ~5.5% in-place yield toward ~8% as units turn.
The combination of below-market in-place income, well-maintained 1976 construction, and resilient West Valley fundamentals broadens the buyer pool from pure yield buyers to value-add operators.
"The in-place cap is only 5.5%."
It reflects rents roughly 33% below market. As units turn, scheduled income moves from $136,859 toward an estimated $182,700, stabilizing the asset near an 8% yield on the offering price. Two units have been leased since 1991 at ~$1,325.
"It's RSO rent-controlled."
Yes — and the upside is captured through allowable annual increases and vacancy decontrol on natural turnover. The deep, long-tenured discount is precisely what makes the turnover so valuable; few West Valley assets offer this spread.
"Taxes will jump on reassessment."
Minimal here. Current real-estate taxes of ~$21,400 imply an assessed basis already near $1.7M, so reassessment at the offering price is roughly tax-neutral — an unusual benefit that protects going-in yield.
"Older building - deferred maintenance?"
Major capital is already in place: the mandatory soft-story seismic retrofit was completed in 2021 (Certificate of Compliance issued), all seven units' A/C was replaced in 2019, and two tankless water heaters were added in 2022. Combined with low historical repairs (~$3,300/yr), that supports a clean go-forward expense profile. Buyer to confirm systems and roof in DD.
Interactive map — gold pin = subject (21727 Lassen St); numbered navy pins = the four comparables. Click any pin for details. Open in Google Maps ↗
| Address | Submarket | Yr | Units | Price | $/Unit | $/SF | Cap | GRM | Status |
|---|---|---|---|---|---|---|---|---|---|
| 21727 Lassen St (Subject) | Chatsworth | 1976 | 7 | $1,655,000 | $236,429 | $265 | 5.50% | 12.09x | Offered |
| 8807 Canby Ave | Northridge | 1953 | 5 | $1,182,500 | $236,500 | $241 | 4.69% | 12.50x | Sold Apr 2026 |
| 17956 Schoenborn St | Northridge | 1959 | 6 | $1,410,000 | $235,000 | $284 | 6.44% | 9.31x | Sold Nov 2025 |
| 17944 Schoenborn St | Northridge | 1959 | 6 | $1,110,000 | $185,000 | $224 | 5.67% | 11.10x | Sold Oct 2025 |
| 17945 Roscoe Blvd | Northridge | 1959 | 6 | $1,250,000 | $208,333 | $252 | 5.56% | 11.28x | Under Contract |
| Average (4 comparables) | $1,238,125 | $216,208 | $250 | 5.59% | 11.05x | - | |||
Closed sales. Three recent West Valley trades frame the value. 8807 Canby Ave (5-unit, 1953) closed April 2026 at $236,500/unit, a tight 4.69% cap, and a 12.5 GRM in a one-month window - below-market in-place rents like the subject, setting the per-unit benchmark. 17956 Schoenborn St (6-unit, 1959) sold November 2025 at $235,000/unit, $284/SF, a 6.44% cap, and a 9.31 GRM - notably with 4 of its 6 units vacant at close, a near-market-rent lease-up play that shows where a West Valley building trades once rents reach market, exactly the upside 21727 Lassen captures as units turn. 17944 Schoenborn St (6-unit, 1959, 4,962 SF per title) sold October 2025 at $185,000/unit, $224/SF, a 5.67% cap, and an 11.1 GRM, anchoring the floor on condition and in-place rents.
Active demand. 17945 Roscoe Blvd (6-unit, 1959) went under contract in 82 days at $208,333/unit and a 5.56% cap, confirming that well-located West Valley apartments clear when priced inside the comp range. Per the comp set, West Valley apartment cap rates currently range from roughly 3.85% to 6.97%.
Positioning. Across the four comparables the average is $216,208/unit, $250/SF, and a 5.59% cap. The subject's newer 1976 vintage and townhouse-style layout support a measured premium to that average, while its ~33% below-market rents keep the going-in 5.50% cap right in the comp band with clear room to grow. At $1,655,000 the subject is positioned to clear inside an industry-standard 60-90 day window, not to sit.
In-place rents per owner rent roll as of 6/1/2026. Market rents are LAAA estimates for a 1976 Chatsworth townhouse-style asset; per-unit SF is approximate (CoStar GBA 6,238 SF).
| Unit | Type | SF | In-Place | Market | Status | Notes |
|---|---|---|---|---|---|---|
| 01 | 1BR / 1BA | 825 | $1,709 | $2,025 | Occupied | In place since 2018 |
| 02 | 2BR / 1BA | 1,025 | $2,361 | $2,450 | Occupied | Since 2021 - near market |
| 03 | 1BR / 1BA | 825 | $1,325 | $2,025 | Occupied | Since 1991 - deep upside |
| 04 | 1BR / 1BA | 825 | $1,758 | $2,025 | Occupied | In place since 2021 |
| 05 | 1BR / 1BA | 825 | $1,441 | $2,025 | Occupied | In place since 2014 |
| 06 | 1BR / 1BA | 825 | $1,329 | $2,025 | Occupied | Since 1991 - deep upside |
| 07 | 2BR / 2BA | 1,088 | $1,482 | $2,650 | Occupied | Since 1994 - deep upside |
| Total | 7 units | 6,238 | $11,405/mo | $15,225/mo | 100% occ. | $136,859 vs $182,700/yr |
| Income | Annual | Per Unit | $/SF | % EGI |
|---|---|---|---|---|
| Gross Scheduled Rent [1] | $136,859 | $19,551 | $21.94 | - |
| Less: Economic Vacancy (3%) | ($4,106) | ($587) | ($0.66) | - |
| Plus: Laundry Income [2] | $2,913 | $416 | $0.47 | - |
| Plus: Cost Recovery / RUBS [3] | $5,376 | $768 | $0.86 | - |
| Effective Gross Income | $141,042 | $20,149 | $22.61 | 100% |
| Expenses | Annual | Per Unit | $/SF | % EGI |
|---|---|---|---|---|
| Real Estate Taxes [4] | $20,688 | $2,955 | $3.32 | 14.7% |
| Insurance [5] | $6,214 | $888 | $1.00 | 4.4% |
| Water / Sewer [6] | $4,517 | $645 | $0.72 | 3.2% |
| Trash [7] | $1,500 | $214 | $0.24 | 1.1% |
| Repairs & Maintenance [8] | $4,500 | $643 | $0.72 | 3.2% |
| Contract Services [9] | $3,800 | $543 | $0.61 | 2.7% |
| Management (5% EGI) [10] | $7,052 | $1,007 | $1.13 | 5.0% |
| Reserves [11] | $1,750 | $250 | $0.28 | 1.2% |
| Total Operating Expenses | $50,021 | $7,146 | $8.02 | 35.5% |
| Net Operating Income | $91,021 | $13,003 | $14.59 | 64.5% |
[1] Gross Scheduled Rent: In-place contractual rents per the owner rent roll dated 6/1/2026, totaling $11,405/mo ($136,859/yr). At market, scheduled rent is an estimated $182,700/yr (~33% upside), underwritten conservatively to in-place here.
[2] Laundry Income: On-site common laundry, $2,913/yr (2026 YTD annualized).
[3] Cost Recovery / RUBS: Utility cost recovery billed back to tenants, $5,376/yr (2026 YTD annualized).
[4] Real Estate Taxes: LA County reassesses to purchase price at close; shown at 1.25% of the $1,655,000 list price ($20,688). Current taxes (~$21,434) already imply an assessed basis above the offering price, so reassessment is roughly neutral to slightly favorable.
[5] Insurance: 2025 owner actual ($6,214).
[6] Water / Sewer: Owner-paid, master-metered. Per the 2026 YTD-annualized owner-actual utilities of $6,017, allocated as Water/Sewer $4,517 + Trash $1,500. Tenants are individually metered for in-unit gas & electric.
[7] Trash: Owner-paid trash, allocated from the owner-actual utilities total (see [6]).
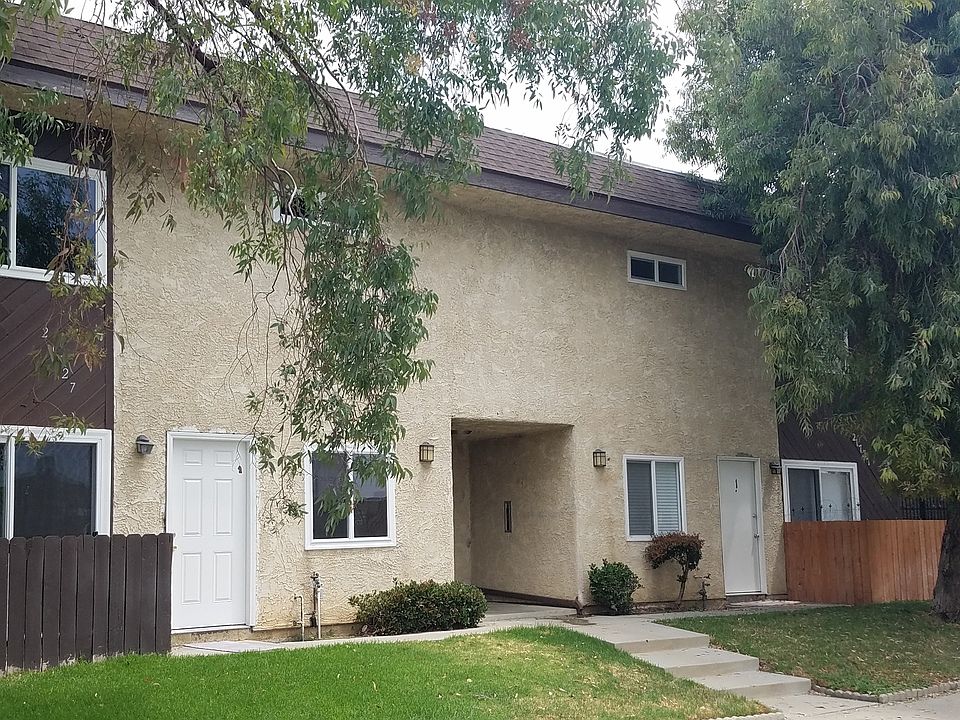
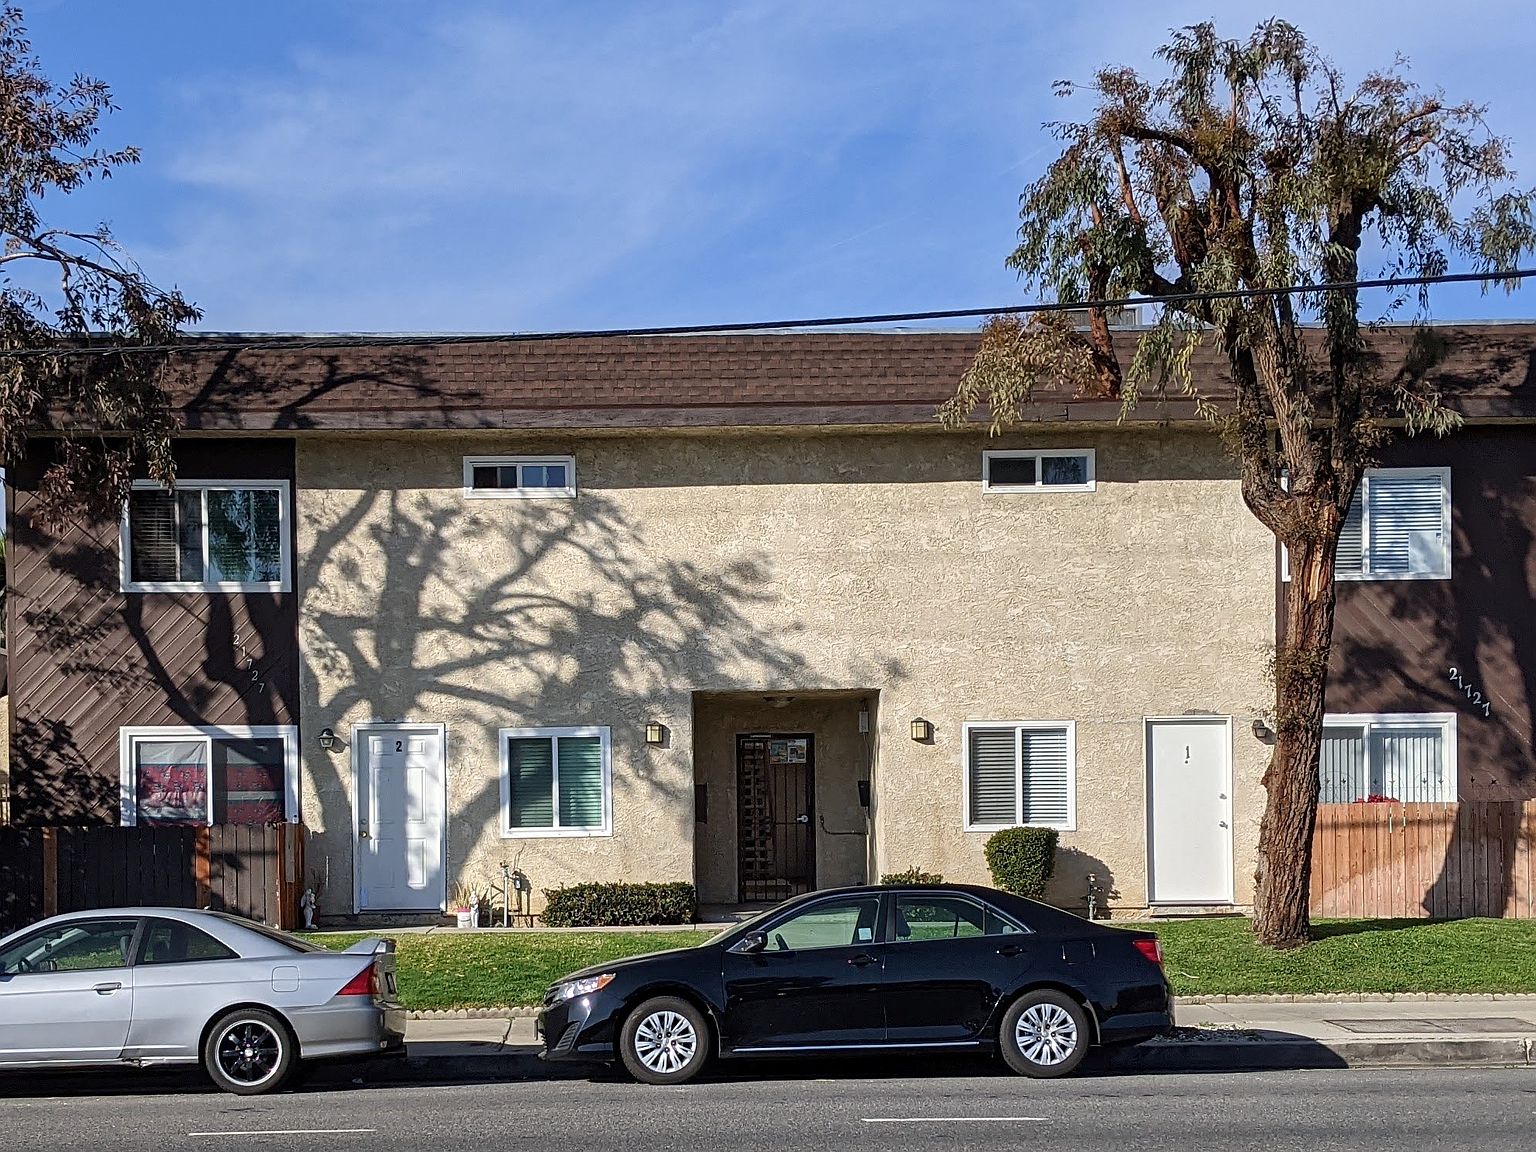
[8] Repairs & Maintenance: Normalized to ~$643/unit, above the 2025 actual (~$3,265) to reflect a buyer's reserve for a 1976 asset.
[9] Contract Services: Gardening, pest control, fire/life-safety, and telephone/alarm per 2025 actuals (~$3,800 combined).
[10] Management: Off-site professional management underwritten at 5% of effective gross income.
[11] Reserves: $250/unit, standard for 1976 vintage.
Reassessed NOI of $91,021 uses owner-actual insurance, utilities, laundry and cost-recovery income, and includes a 5% management load; the seller has operated without third-party management (2024 NOI $90,826; 2025: $94,935; 2026 YTD annualized: ~$98,680). Buyer to verify all actuals in due diligence.
| Operating Data | |
|---|---|
| Price | $1,655,000 |
| Down Payment | $662,000 |
| Number of Units | 7 |
| Price / Unit | $236,429 |
| Price / SF | $265 |
| Gross SF | 6,238 |
| Year Built | 1976 |
| Returns (Reassessed) | |
|---|---|
| Cap Rate (In-Place) | 5.50% |
| Cap Rate (at Market) | ~8.0% |
| GRM (In-Place) | 12.09x |
| Cash-on-Cash | 2.96% |
| DSCR | 1.27x |
| Financing | |
|---|---|
| Loan Amount | $993,000 |
| Rate / Amort | 6.00% / 30yr |
| Loan Constant | 7.19% |
| LTV (actual) | 60.0% |
| Constraint | LTV |
| Income | |
|---|---|
| Gross Scheduled Rent | $136,859 |
| Less Vacancy (3%) | ($4,106) |
| Plus Other Income | $8,289 |
| Effective Gross Income | $141,042 |
| Operating Expenses | ($50,021) |
| Net Operating Income | $91,021 |
| Cash Flow | |
|---|---|
| Net Operating Income | $91,021 |
| Debt Service | ($71,443) |
| Net Cash Flow | $19,578 |
| Cash-on-Cash | 2.96% |
| + Principal Reduction | $12,196 |
| Total Return | 4.80% |
| Expense Ratio | |
|---|---|
| OpEx / EGI | 35.5% |
| OpEx / Unit | $7,146 |
| OpEx / SF | $8.02 |
| Purchase Price | Cap Rate | Cash-on-Cash | $/Unit | $/SF | GRM | DSCR |
|---|---|---|---|---|---|---|
| $1,905,000 | 4.61% | 1.65% | $272,143 | $305 | 13.92x | 1.20x |
| $1,855,000 | 4.77% | 1.78% | $265,000 | $297 | 13.55x | 1.20x |
| $1,805,000 | 4.94% | 1.92% | $257,857 | $289 | 13.19x | 1.20x |
| $1,755,000 | 5.11% | 2.09% | $250,714 | $281 | 12.82x | 1.20x |
| $1,705,000 | 5.30% | 2.46% | $243,571 | $273 | 12.46x | 1.23x |
| $1,655,000 | 5.50% | 2.96% | $236,429 | $265 | 12.09x | 1.27x |
| $1,605,000 | 5.71% | 3.48% | $229,286 | $257 | 11.73x | 1.32x |
| $1,555,000 | 5.93% | 4.04% | $222,143 | $249 | 11.36x | 1.37x |
| $1,505,000 | 6.17% | 4.64% | $215,000 | $241 | 11.00x | 1.43x |
| $1,455,000 | 6.43% | 5.28% | $207,857 | $233 | 10.63x | 1.49x |
| $1,405,000 | 6.70% | 5.96% | $200,714 | $225 | 10.27x | 1.55x |
The list price of $1,655,000 reconciles three independent pricing lenses against the four-comparable set (average $216,208/unit, $250/SF, 5.59% cap). On a per-unit basis ($236,429) it sits ~9% above the comp average, supported by the subject's newer 1976 vintage (versus the 1953-1959 comps) and townhouse-style layout. On cap rate (5.50% in-place) it lands just inside the comp average of 5.59% while offering a clear path toward ~8% as the ~33% below-market rents move to market. On price-per-SF ($265) it carries a modest premium to the $250 average and remains below the highest comp ($284, 17956 Schoenborn).
All returns are underwritten after a 5% management load, so the going-in yield is a true third-party-managed figure. The price is anchored at the disciplined, comp-supportable end of the range and is positioned to clear within an industry-standard 60-90 day marketing window, with room for upward buyer-side negotiation given the strength of the mark-to-market story.